The results are in for 2015, and wind and solar had another banner year across much of the world.
Both industries have been buoyed by dramatically lower costs. Over the past six years, wind-generated electricity has declined 61% and solar 82%, according to Lazard – a pace we only expect to see for information technology.
If solar prices contine to drop 10% a year, as expected, it will supply 20% of global electricity by 2027, say Oxford University researchers.
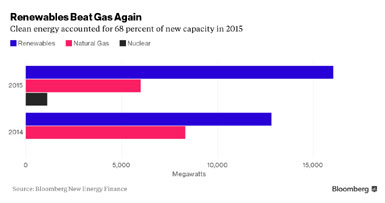
In the US, solar and wind accounted for 68% of all new electrical capacity in 2015 with 16 gigawatts (GW) installed, almost evenly divided between the two, says Bloomberg New Energy Finance.

Solar Worldwide
Another 59 GW of solar PV was installed worldwide, up 34% from 2014, according to GTM Research.
China installed 15 GW of that – a 37% rise – making it the world leader on both solar and wind capacity. With a total of 43 GW of solar installed, China has overtaken Germany, which had a really slow year – adding only 1.4 GW, according to The PV Market Alliance.
- Japan: 10 GW
- US: 8 GW
- EU: 8.5 GW, half in the UK
- India: 2 GW
- Australia, Asia (except China): 2.5 GW
- Central, South America: 1.5 GW
- Middle East, Africa: 1 GW
Read our article about the US, Solar Has Another ‘Best Year Ever’ in 2014.
Wind Worldwide
Denmark supplied 42% of its electricity from wind last year, setting a world record.
The world added 63 GW of wind, a 22% increase, bringing the total to 432.4 4 GW, according to the Global Wind Energy Council (GWEC).
China now has 145 GW installed, after adding a record 30.5 GW – up 40% and half the world’s installations last year. Europe followed with 12 GW – half in Germany – and US installations rose 77% to 8.6 GW for the year.
Wind now provides 15.6% of Europe’s electricity with 141.6 GW total, almost tied with hydro, and behind only gas at 21.1%.
The US has a total of 75 GW, up from 17 GW at the beginning of 2008.
Texas continues to lead with 17 GW total, more than twice the amount of any other state. Iowa and California are tied at around 6 GW, followed by Oklahoma, with over 5 GW. Wind projects have reached 40 states.
Other major wind markets for 2015 were India (2.6 GW) and Brazil (2.8 GW).
2016?
Solar and wind will boom in the US this year, thanks to renewed tax incentives, but pullbacks on incentives (feed-in laws) in the UK, Japan and China are tempering projections worldwide.
GTM Research expects 64 gigawatts of solar PV to be installed globally in 2016, led by the US and China. They expect 321 GW installed worldwide by the end of 2016.
We haven’t seen projections for wind yet.
Read our articles, Good Signs Abound For Renewable Energy Worldwide, Tackling Climate Change and Milestone Passed: World Adds Over 100 GW of Renewables in 2014.
 Loading...