After going over President Obama’s head to approve the Keystone pipeline tomorrow – a terrible decision for which both parties are to blame – Republicans will move on to the next environmental drama: preventing EPA’s power plant regulations from entering force.
They will rail against the Clean Power Plan, and could even shut down the government over EPA’s "War on Jobs and the Economy," by refusing to approve a federal budget that includes funding for it.
The fact is that many states are well-positioned to meet and even exceed EPA’s emission reduction targets, which are customized for each state based on its situation.
In addition to adding pollution controls to outdated coal plants, an easy way for states to reduce emissions is simply to use more renewable energy, and states with strong Renewable Portfolio Standards (RPS) are already doing that. States that will fight the rules are those that have shown no interest in investing in clean energy.
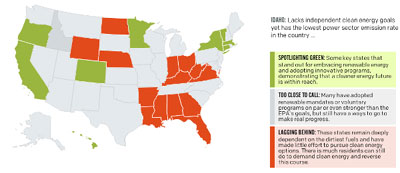
See Where Your State Stands
As part of its report, Coming Clean: The State of U.S. Renewable Energy, Earthjustice posted a map that shows where each state gets its energy and how it is progressing – or not – on clean energy use.

California’s RPS, for example, requires 33% renewable energy by 2020, but the EPA requires only 21% by 2030.
- Connecticut: RPS requires 27% by 2020; EPA requires 9% by 2030
- Massachusetts: RPS requires 22% by 2020; EPA requires 24% by 2030
- New York: RPS require 29% by 2015; EPA requires 18% by 2030
- Minnesota: RPS requires 31% by 2020; EPA requires 15% by 2030
- Colorado: RPS requires 30% by 2020; EPA requires 21% by 2030
- Oregon: RPS requires 25% by 2025; EPA requires 21% by 2030
- Hawaii: RPS requires 40% by 2030; EPA requires 10% by 2030
On the other end of the spectrum are 13 states like Kentucky, Alabama and Wyoming, which have no RPS or emission reduction programs.
Sadly, ALEC and other fossil fuel interests convinced Ohio to freeze its RPS, and now it’s joined the other laggards to sue EPA.
War on Economy?
"EPA’s carbon proposal will cause electricity prices to skyrocket for American families and businesses, and we should all be concerned about the health consequences of higher energy costs, weakened electric reliability, widespread job losses and systemic economic devastation," says the American Coalition for Clean Coal Electricity – the group that got caught forging letters in advance of the 2009 cap-and-trade vote.
Pretty horrible, right?
How much does meeting a RPS really cost? About 1% of retail electric rates, on average, according to A Survey of State-Level Cost and Benefit Estimates of Renewable Portfolio Standards by the Department of Energy’s National Renewable Energy Lab and Lawrence Berkeley National Lab. That’s well below the cost caps most state legislatures have adopted as part of their RPS.
Another study, this time by MIT, shows that policies intended to lower emissions easily pay for themselves in lower health care costs.
"Carbon-reduction policies significantly improve air quality," says Noelle Selin, co-author of the study, which compares economic costs with the health benefits of policies that will likely be used to comply with the Clean Power Plan: a RPS, a transportation policy, and a cap-and-trade program.
- Cap-and-trade program: costs $14 billion, saves $125 billion in health costs!
- Renewable Portfolio Standard: costs $208 billion, saves $247 billion
- Transportation policy with rigid fuel economy requirements: costs $1 trillion, health benefits recoup only 25% of costs.
"If cost-benefit analyses of climate policies don’t include the significant health benefits from healthier air, they dramatically underestimate the benefits, says lead author Tammy Thompson.
The study is the most detailed assessment to date of the interwoven effects of climate policy on the economy, air pollution, and the cost of health problems related to air pollution.
As of 2011, 231 US counties exceeded EPA ozone standards (the main component of smog) and 118 counties exceeded fine particulate matter standards, so there’s plenty of room to improve air quality.
Check out the map at Earthjustice: