Dovetailing their June report showing the promise of
renewable energy technology to serve US electricity needs, scientists at the
National Renewable Energy Laboratory (NREL) are providing detailed guidance
about the state-by-state potential.
And contrary to the common myth that only certain states
will have a stake in the clean energy movement, the NREL analysis finds that
every state has the space and resources to generate clean energy.
"Decision-makers using the study will get a sense of
scale regarding the potential for renewables, and which technologies are worth
examining," says NREL’s Anthony Lopez, a co-author of the study.
"Energy modelers also will find the study valuable."
In June, the NREL predicted that 80% of the nation’s
power could be generated by clean energy sources by 2050. About 5% of US power
today comes from renewable energies such as solar, wind, hydropower, geothermal
or biomass.
The new NREL report, US RE Technical Potential, maps the
"could be" scenarios for key renewable technologies in each state.
The forecasts strictly consider technical system performance, topographical
limitations, environmental and land-use constraints but they don’t account for
economic conditions.
The total technical capacity potential for renewable
energy technologies identified by NREL is 212,224 gigawatts (GW), says NREL.

What’s the high-level view on which states hold the most
promise?
When it comes to solar, large populations and abundant
sunlight make Texas and California key locations. There is offshore wind
potential along all US coasts, while potential for onshore development exists
in almost every state. Meanwhile, 13 states show particular promise when it
comes to geothermal development, says NREL.
Updates to the report are planned over time. For now,
though, here is a snapshot of the annual technical potential for each renewable
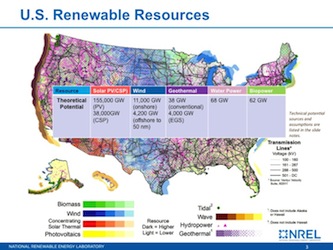
energy type, according to the NREL analysis:
Solar (155,000 GW for PV, 38,000 GW for CSP)
Rural utility-scale solar projects lead all other clean
energy technologies in terms of their overall estimated technical potential,
says NREL.
Texas and California have the highest estimated capacity
because of their geography and because their large populations make solar
projects more attractive than in other places.
Texas accounts for 14% of the utility-scale PV potential
and 20% of the CSP potential, while California leads when it comes to rooftop
PV.
Wind (11,000 GW for onshore, 4,200 GW for offshore)
There is potential for wind projects in every state,
although the best opportunities are still in Western and Central Great Plains
states. The potential is lowest in the Southeast, while certain states in the
East and West are constrained by environmental exclusions.
Here again, Texas looks good: it has the highest
estimated potential for onshore wind, roughly 17% of capacity.
When it comes to offshore wind power, wind speeds off
Atlantic Coast and in the Gulf of Mexico are lower than they are off the
Pacific Coast, but their shallower waters make them more attractive for
development. Hawaii has the highest estimated annual potential of all the
states, about 17% of the total.
Geothermal (38 GW conventional, 4,000 GW enhanced)
13 states lead the way when it comes to hydrothermal
projects including (in alphabetical order) Alaska, Arizona, California,
Colorado, Hawaii, Idaho, Montana, Nevada, New Mexico, Oregon, Utah, Washington
and Wyoming.
When it comes to enhanced systems, the Rocky Mountain
states and those associated with the Great Basin offer the most favorable
resources.
Hydropower (68 GW)
Much of the opportunity lies in the Northwest and Alaska,
which together account for about 27% of the technical potential.
Biopower (62 GW)
Solid biomass, especially crop residues, are the largest
contributor in this area accounting for about 82% of total technical capacity.
The rest comes mainly from energy generated by landfill gases. While potential
is spread across all of the states, the five with the highest capacity
potential are Illinois, Iowa, California, Texas and Minnesota.
For the complete report:
 Loading...