Few people are aware that energy intensity in the US has been declining for decades and will continue to do so, according to the US Energy Information Agency (EIA).
Defined as energy consumption per unit of gross domestic product (GDP), energy intensity has been declining steadily since the early 1970s because of ever-increasing efficiency, as well as structural changes in the economy.
From 1950-1973, it dropped, but not much – less than 1% a year, but that changed in 1974 when the Arab oil embargo led to a 56% spike in gas prices and people waited on long lines to fuel their cars.
That’s when the US first established fuel economy standards for vehicles.
Since then, energy intensity has been declining at 2% a year, a total drop of 58% per real dollar of GDP since 1950.
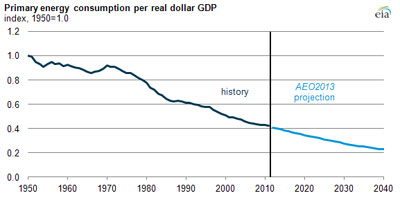
Since then, energy-intensive industries have played a smaller role in the US economy, also pushing energy intensity down.
EIA data shows this trend will continue, with energy intensity declining 2% a year through 2040.
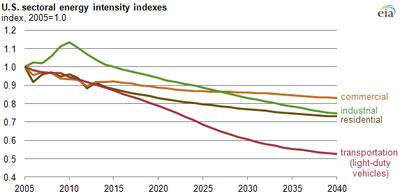
They also find that from 2005-2040:
- Residential energy intensity, measured as delivered energy used per household, will drop 27%.
- Commercial energy intensity, measured as delivered energy used per square foot of commercial floorspace, will decline 17%.
- Industrial sector energy intensity, measured as delivered energy per dollar of industrial sector shipments, will drop 25%.
- Light-duty vehicles, by far the largest energy consuming part of the transportation sector, measured by energy consumption divided by the number of vehicle-miles traveled, will decline more than 47%.