As we have reported, 2013 was another record year for US solar, rising an impressive 41% – the year we joined Germany, China and Japan as worldwide leaders.
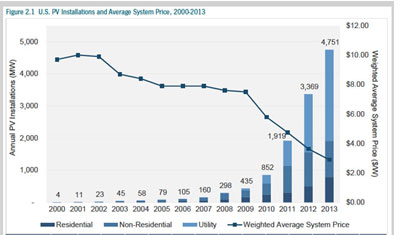
Now, the finally tally is in. Last year, 140,000 solar systems were installed, a total of 4.75 gigawatts (GW) – 15 times what was installed in 2008! Almost half of that came online in the fourth quarter alone, making it by far the best quarter yet for the industry.
"Perhaps more important than the numbers, 2013 offered the US solar market the first real glimpse of its path toward mainstream status. The combination of rapid customer adoption, grassroots support for solar, improved financing terms, and public market successes displayed clear gains for solar in the eyes of both the general population and the investment community," notes Shayle Kann, Senior Vice President at GTM Research.
Altogether, there’s now 12 GW of solar PV in the US – roughly 440,000 solar systems, according to Solar Energy Industries Association (SEIA) and GTM Research.
This year, they expect installations to grow by 26% for a total of 6 GW, which will bring the US just shy of the cumulative 20 GW milestone.
Solar now trails only natural gas as the biggest source of new generating capacity and should be competitively priced in another 10 years.
Costs to install solar continued their decline last year, falling another 15%, reaching a new low of $2.59 per watt in the fourth quarter.

"Residential solar in the US is
becoming the bedrock of demand for solar and is really a market segment that
benefits from extremely attractive economics," says Kann. For homeowners, solar installations jumped 60%, adding 792 MW.
Now that many of the biggest utility-scale solar projects are online – 2.8 GW last year – demand seems to be shifting to projects in the 1-20 MW range, says Arno Harris, CEO of SEIA.
"Today, solar is the fastest-growing source of renewable energy in America, generating enough clean, reliable and affordable electricity to power more than 2.2 million homes – and we’re just beginning to scratch the surface of our industry’s enormous potential," exclaims Rhone Resch, CEO of SEIA.
California, of course, still leads the states by a wide margin, with more than 50% of installations last year. Incredibly, more solar was installed in California last year than in the entire country in 2011. The top five states – California, Arizona, North Carolina, Massachusetts, and New Jersey – accounted for 81% of all 2013 installations.
Solar Transitioning to a Supply-Driven Market
During the recession, there was way more supply than demand, resulting in painful over-capacity and over-supply problems. Combine that with the slide in prices of some 50% in just three years, and the stage was set for some serious consolidation among manufacturers.
Last year’s shakeout has reduced the number of solar PV cell manufacturers to 150, as 100 either closed their doors or were acquired. And that’s bringing the demand-supply ratio into balance again.
In fact, this should be a watershed year – when the industry shifts from a demand-constrained market into a classic supply-driven market, says NPD Solarbuzz.
"Ultimately 2014 year-end demand will be determined by how much product can be produced and shipped, analogous to a classic supply-driven market environment," says Michael Barker, senior analyst at NPD Solarbuzz.
Worldwide Solar
2013 also broke records worldwide with 37 GW of solar installed, growing 35%, to a cumulative total of 136.7 GW.
It was also the year when Asia took the leadership from Europe, says the European Photovoltaic Industry Association (EPIA). After owning 70% of the market just a couple years ago, and adding a still amazing 10 GW last year, Europe only accounts for
28% of the world’s market.
"In a number of European countries, harsh support reduction, retrospective measures and unplanned changes to regulatory frameworks that badly affect investors’ confidence and PV investments viability have led to a significant market
decrease, says Gaëtan Masson, Head of Business
Intelligence for EPIA.
Worldwide, there’s 100 GW in the solar pipeline and that’s just in the leading countries.
2013 was also a record-breaking year
Read, Solar Market Insight Report 2013 Year in Review:
 Loading...