Data shared by Lawrence Berkeley National Lab (LBNL) at the 2012 National Renewable Summit on RPS shows just how effective state Renewable Portfolio Standards (RPS) are in building out US clean energy capacity.
Since 1998, the US has installed 53 gigawatts of non-hydro renewable energy and the majority (63%) is in states that have an active or pending RPS.
29 states and Wash DC have an RPS, which require utilities to source a certain percentage of energy from renewables by a target date (the percentage and target date varies greatly between states).
With the addition of another 60 GW of renewable energy capacity, all states with RPSs will have met their goals.
"The cumulative amount of new capacity required is fairly significant, at least related to what’s in place today, but the actual pathway and ramp rate required to get there doesn’t require a huge amount of stretching, at least at a gross national level," says Galen Barbose, a LBNL staff research associate. "The actual ramp rate required to get there is in fact well within the pace we’ve been adding renewables within past couple years."
Unfortunately, the introduction of new RPS initiatives has significantly slowed and most states haven’t upped their targets as they close to meeting them.
California is one of the few states that significantly raised its target when it got close to meeting it. It now requires renewables to provide 33% of the state’s electricity by 2020, up from 20% by 2010. Last February, the state hit an important milestone – wind now supplies 5% of its electricity.
And ALEC is working to undermine state RPS programs with legislation so far introduced in 10 states to repeal or roll back RPS policies. None of these efforts has succeeded to date.
Although ALEC views state RPSs as a tax on consumers that unfairly mandates some energy sources over others, LBNL’s research shows that electric rates have risen less than 5%. In fact, states that have an RPS report the costs of renewable energy are dropping.
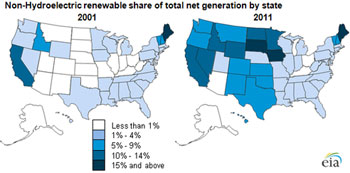
This map, from the US Energy Information Administration, shows the significance of an RPS – it shows the growth of non-hydro renewables in states with and without an RPS.

Download the presentation:
 Loading...