The U.S. Energy Information Administration (EIA) has launched a valuable resource that shows energy data for every state.
Curious about which states produce the most energy and which kinds? How much energy is consumed per capita and how much emissions?
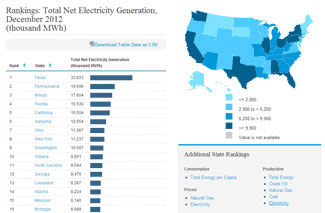
Click on a state and you’ll get a quick, informative profile. You can compare states and rankings and customize maps and charts. And you can drill down to county and even Congressional district.
Users can pan and zoom in to see energy facilities and resources related
to:
- Production: power plants, oil refineries, and coal mines
- Distribution: electric transmission lines, natural gas pipelines, and
liquefied natural gas import terminals - Fossil fuel resources: coal, oil, and natural gas basins, plays, and
fields - Renewable energy resources: wind, solar, biomass, and geothermal potential
In addition to customizable maps, the portal summarizes each state’s energy production, consumption, prices, and more.

For detailed information on any of the 6,300
power plants in the US, such as the amount of fuel used and monthly
output of a specific facility, the portal links directly to that plant’s
data in EIA’s electricity data
browser.
There’s a help function with
popup notes that explain the navigation, and a video
demonstration of its features.
Recently, House Democrats released an Energy App that with the slide of a finger shows decades of US energy production – including wind, solar, coal, and oil – and you can compare states to find out which are the most energy efficient.
Check out EIA’s map:
 Loading...